
Tuesday, October 15
Wednesday, August 31


Wednesday, October 1
Wednesday, November 13
UVA vs VCU Super Tuesday
The top teams in the country were playing in Chicago, but the undercard for the top ten battles was No.14 VCU at No 25 UVA. Here are my observations from the game:
- UVA Offensive Rebounding - In games against UNC last year, UVA abandoned any chance of offensive rebounds by retreating into their defense after a shot was missed. That was not the case tonight, as UVA bigs, especially subs, crashed the boards. There could be several reasons for this, but UVA had 12 offensive rebounds. VCU only had 20 defensive boards.
- Fouls - We know the NCAA wants hand checks called more tightly, and boy, were there lots of whistles. There were 48 fouls called in this game. Both teams were in the double bonus with five minutes left in the first half. Unfortunately, neither team could take advantage. UVA shot 19/33 (there were a great many bailout calls) for 57.6 % and VCU was even worse, 6/15 or 40 %.
- VCU Ball Movement - VCU didn't take many three point shots, but instead moved the ball around and into the post. Terrance Shannon for VCU was the only post player who knew what to do with the ball once he got it. Treveon Graham got plenty of looks running off picks going towards the basket. VCU hit two late 3's to close the gap and eventually beat UVA.
- HAVOC - VCU's defense doesn't just get turnovers in the areas you expect, they also force them close to the opponent's basket. Once teams hurriedly get the ball across the timeline, you'll see VCU double up on the guy who catches the ball, leading to a bad pass or jump ball tie-up around the top of the key.
- UVA vs VCU rivalry - The Battle for the Commonwealth will hopefully be a recurring feature. Very different schools, fan bases and styles of basketball. Great game, great fans, both sides got good and rowdy. Can't wait for the return feature in Richmond next season.
- Kicks - Can you tell who's a scrub based on the footwear you see below?


Thursday, March 7
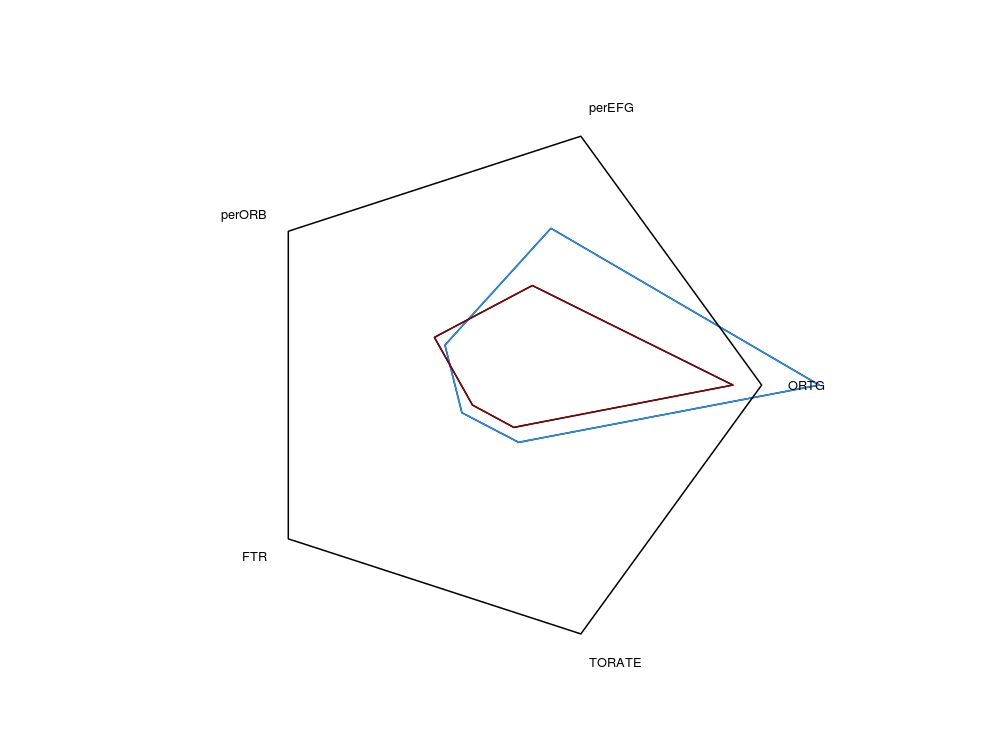
Maryland Stats

$`Four Factors`
       OPP      NAME ORTG perEFG perORB  FTR TORATE
1 Maryland     Total 1.16   0.55   0.31 0.44   0.18
2 Maryland oppTotals 1.00   0.45   0.34 0.24   0.21

$`Last Game`
           POSS ORTG  USG perFTM perFGM perFGM.3 perORB perDRB perTS  FTR perEFG ARATE TORATE
Bullock       9 2.11 0.14   0.75   0.75     0.67   0.07   0.29  0.97 0.50   1.00  0.09   0.11
McAdoo       14 0.71 0.25   0.80   0.27      NaN   0.04   0.03  0.38 0.45   0.27  0.05   0.14
Hubert        0  NaN 0.00    NaN    NaN      NaN   0.00   0.00   NaN  NaN    NaN  0.00    NaN
Strickland    5 1.60 0.12   1.00   0.50      NaN   0.05   0.04  0.69 1.00   0.50  0.38   0.00
Paige        15 0.60 0.27    NaN   0.43     0.43   0.00   0.10  0.64 0.00   0.64  0.15   0.53
James        NA   NA   NA     NA     NA       NA     NA     NA    NA   NA     NA    NA     NA
Hairston     17 1.29 0.32   0.67   0.47     0.29   0.12   0.17  0.58 0.60   0.53  0.05   0.06
Johnson       2 2.00 0.17   1.00   0.33      NaN   0.33   0.14  0.52 0.67   0.33  0.00   0.00
McDonald      6 1.17 0.16    NaN   0.43     0.25   0.06   0.05  0.50 0.00   0.50  0.00   0.00
Tokoto        0  NaN 0.00    NaN    NaN      NaN   0.00   0.00   NaN  NaN    NaN  0.00    NaN
Davis        NA   NA   NA     NA     NA       NA     NA     NA    NA   NA     NA    NA     NA
Simmons      NA   NA   NA     NA     NA       NA     NA     NA    NA   NA     NA    NA     NA
Total        68 1.16 1.00   0.79   0.45     0.42   0.31   0.61  0.60 0.44   0.55  0.52   0.18
oppTotals    68 1.00 1.00   0.73   0.43     0.13   0.34   0.66  0.49 0.24   0.45  0.33   0.21

$`Season Totals`
         NAME POSS ORTG  USG perFTM perFGM perFGM.3 perORB perDRB perTS  FTR perEFG ARATE TORATE
1     Bullock  298 1.40 0.19   0.75   0.49     0.45   0.07   0.15  0.64 0.21   0.62  0.13   0.11
2      McAdoo  469 0.93 0.29   0.57   0.45     0.00   0.09   0.18  0.48 0.39   0.45  0.06   0.18
3      Hubert   29 1.21 0.05   0.21   0.53      NaN   0.07   0.11  0.48 0.47   0.53  0.01   0.45
4  Strickland  260 0.92 0.18   0.66   0.44     0.19   0.02   0.08  0.50 0.44   0.45  0.21   0.14
5       Paige  310 0.73 0.21   0.85   0.33     0.33   0.01   0.10  0.46 0.20   0.41  0.22   0.23
6       James   59 1.07 0.12   0.56   0.50      NaN   0.09   0.17  0.52 0.30   0.50  0.03   0.34
7    Hairston  317 1.20 0.29   0.77   0.42     0.38   0.08   0.12  0.58 0.30   0.54  0.09   0.10
8     Johnson  159 1.19 0.25   0.62   0.53      NaN   0.09   0.23  0.54 0.15   0.53  0.04   0.10
9    McDonald  180 1.01 0.23   0.75   0.38     0.38   0.04   0.08  0.52 0.17   0.49  0.11   0.11
10     Tokoto   89 1.00 0.18   0.38   0.53     0.09   0.09   0.12  0.52 0.35   0.53  0.12   0.30
11      Davis   10 0.80 0.07   1.00   1.00     1.00   0.00   0.04  1.39 1.00   1.50  0.41   0.70
12    Simmons   21 2.67 0.06   0.80   0.67      NaN   0.13   0.12  0.69 0.28   0.67  0.05   0.29
13      Total 2180 1.07 1.00   0.66   0.45     0.38   0.36   0.68  0.53 0.28   0.50  0.61   0.17
14   oppTotal 2180 0.94 1.00   0.69   0.42     0.34   0.30   0.65  0.50 0.25   0.47  0.49   0.22
$`Last Game`
POSS ORTG USG perFTM perFGM perFGM.3 perORB perDRB perTS FTR perEFG ARATE TORATE
Bullock 9 2.11 0.14 0.75 0.75 0.67 0.07 0.29 0.97 0.50 1.00 0.09 0.11
McAdoo 14 0.71 0.25 0.80 0.27 NaN 0.04 0.03 0.38 0.45 0.27 0.05 0.14
Hubert 0 NaN 0.00 NaN NaN NaN 0.00 0.00 NaN NaN NaN 0.00 NaN
Strickland 5 1.60 0.12 1.00 0.50 NaN 0.05 0.04 0.69 1.00 0.50 0.38 0.00
Paige 15 0.60 0.27 NaN 0.43 0.43 0.00 0.10 0.64 0.00 0.64 0.15 0.53
James NA NA NA NA NA NA NA NA NA NA NA NA NA
Hairston 17 1.29 0.32 0.67 0.47 0.29 0.12 0.17 0.58 0.60 0.53 0.05 0.06
Johnson 2 2.00 0.17 1.00 0.33 NaN 0.33 0.14 0.52 0.67 0.33 0.00 0.00
McDonald 6 1.17 0.16 NaN 0.43 0.25 0.06 0.05 0.50 0.00 0.50 0.00 0.00
Tokoto 0 NaN 0.00 NaN NaN NaN 0.00 0.00 NaN NaN NaN 0.00 NaN
Davis NA NA NA NA NA NA NA NA NA NA NA NA NA
Simmons NA NA NA NA NA NA NA NA NA NA NA NA NA
Total 68 1.16 1.00 0.79 0.45 0.42 0.31 0.61 0.60 0.44 0.55 0.52 0.18
oppTotals 68 1.00 1.00 0.73 0.43 0.13 0.34 0.66 0.49 0.24 0.45 0.33 0.21
$`Season Totals`
NAME POSS ORTG USG perFTM perFGM perFGM.3 perORB perDRB perTS FTR perEFG ARATE TORATE
1 Bullock 298 1.40 0.19 0.75 0.49 0.45 0.07 0.15 0.64 0.21 0.62 0.13 0.11
2 McAdoo 469 0.93 0.29 0.57 0.45 0.00 0.09 0.18 0.48 0.39 0.45 0.06 0.18
3 Hubert 29 1.21 0.05 0.21 0.53 NaN 0.07 0.11 0.48 0.47 0.53 0.01 0.45
4 Strickland 260 0.92 0.18 0.66 0.44 0.19 0.02 0.08 0.50 0.44 0.45 0.21 0.14
5 Paige 310 0.73 0.21 0.85 0.33 0.33 0.01 0.10 0.46 0.20 0.41 0.22 0.23
6 James 59 1.07 0.12 0.56 0.50 NaN 0.09 0.17 0.52 0.30 0.50 0.03 0.34
7 Hairston 317 1.20 0.29 0.77 0.42 0.38 0.08 0.12 0.58 0.30 0.54 0.09 0.10
8 Johnson 159 1.19 0.25 0.62 0.53 NaN 0.09 0.23 0.54 0.15 0.53 0.04 0.10
9 McDonald 180 1.01 0.23 0.75 0.38 0.38 0.04 0.08 0.52 0.17 0.49 0.11 0.11
10 Tokoto 89 1.00 0.18 0.38 0.53 0.09 0.09 0.12 0.52 0.35 0.53 0.12 0.30
11 Davis 10 0.80 0.07 1.00 1.00 1.00 0.00 0.04 1.39 1.00 1.50 0.41 0.70
12 Simmons 21 2.67 0.06 0.80 0.67 NaN 0.13 0.12 0.69 0.28 0.67 0.05 0.29
13 Total 2180 1.07 1.00 0.66 0.45 0.38 0.36 0.68 0.53 0.28 0.50 0.61 0.17
14 oppTotal 2180 0.94 1.00 0.69 0.42 0.34 0.30 0.65 0.50 0.25 0.47 0.49 0.22

Wednesday, March 6
Florida St Stats
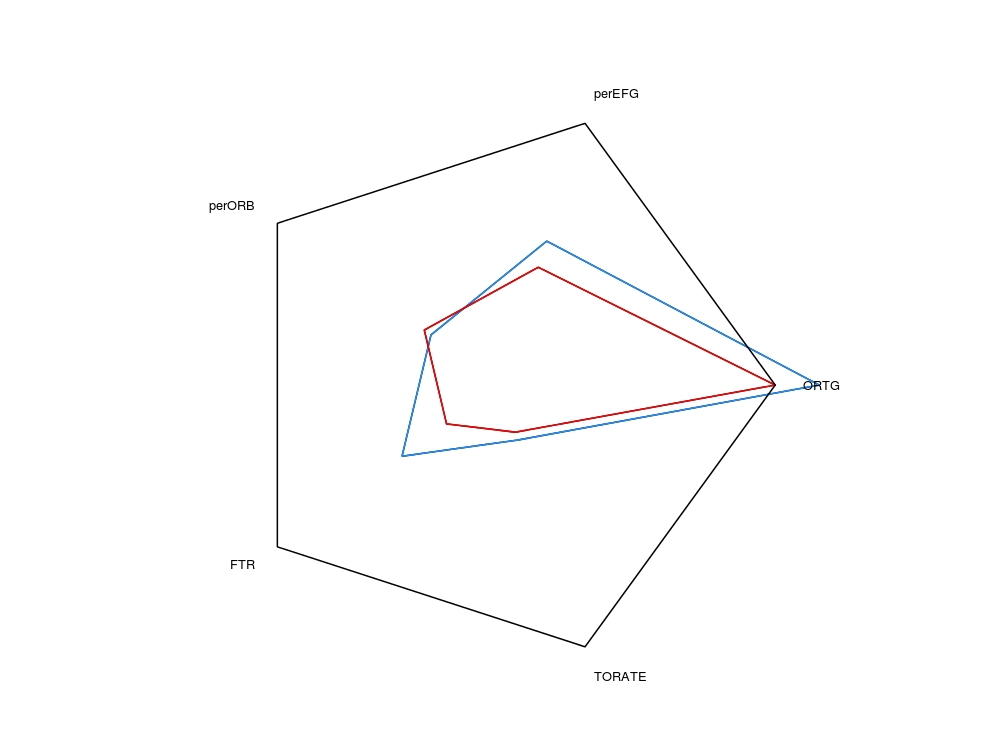
$`Four Factors`
           OPP      NAME ORTG perEFG perORB  FTR TORATE
1 FloridaState     Total 1.22   0.63   0.26 0.18   0.17
2 FloridaState oppTotals 0.89   0.40   0.31 0.13   0.23
 $`Last Game`
POSS ORTG USG perFTM perFGM perFGM.3 perORB perDRB perTS FTR perEFG ARATE TORATE
Bullock 12 1.67 0.21 0.00 0.73 0.57 0.04 0.26 0.87 0.09 0.91 0.18 0.17
McAdoo 16 1.31 0.33 1.00 0.67 NaN 0.10 0.07 0.68 0.07 0.67 0.00 0.19
Hubert 1 2.00 0.21 NaN 1.00 NaN 0.50 0.33 1.00 0.00 1.00 0.00 1.00
Strickland 6 0.83 0.13 0.50 0.40 NaN 0.00 0.04 0.43 0.40 0.40 0.18 0.00
Paige 9 0.67 0.16 0.50 0.40 1.00 0.00 0.09 0.51 0.40 0.50 0.34 0.33
James 1 2.00 0.15 NaN 1.00 NaN 0.00 0.00 1.00 0.00 1.00 0.00 0.00
Hairston 9 1.78 0.19 NaN 0.55 0.67 0.10 0.07 0.73 0.00 0.73 0.04 0.00
Johnson 2 1.00 0.15 NaN 0.50 NaN 0.00 0.12 0.50 0.00 0.50 0.00 0.00
McDonald 7 0.43 0.22 0.75 0.00 0.00 0.00 0.15 0.32 1.33 0.00 0.00 0.29
Tokoto NA NA NA NA NA NA NA NA NA NA NA NA NA
Davis 0 NaN 0.00 NaN NaN NaN 0.00 0.00 NaN NaN NaN 0.00 NaN
Simmons 0 NaN 0.00 NaN 0.00 NaN 0.25 0.17 0.00 0.00 0.00 0.22 NaN
Total 65 1.22 1.00 0.60 0.55 0.60 0.26 0.62 0.65 0.18 0.63 0.65 0.17
oppTotals 65 0.89 1.00 1.00 0.37 0.22 0.31 0.70 0.44 0.13 0.40 0.43 0.23
$`Season Totals`
NAME POSS ORTG USG perFTM perFGM perFGM.3 perORB perDRB perTS FTR perEFG ARATE TORATE
1 Bullock 289 1.38 0.19 0.75 0.49 0.44 0.07 0.14 0.63 0.20 0.61 0.13 0.11
2 McAdoo 454 0.94 0.29 0.56 0.45 0.00 0.09 0.19 0.48 0.38 0.45 0.06 0.18
3 Hubert 29 1.21 0.05 0.21 0.53 NaN 0.07 0.11 0.48 0.47 0.53 0.01 0.45
4 Strickland 255 0.90 0.18 0.64 0.44 0.19 0.02 0.08 0.50 0.43 0.45 0.20 0.14
5 Paige 295 0.73 0.20 0.85 0.33 0.32 0.01 0.10 0.45 0.21 0.41 0.22 0.21
6 James 59 1.07 0.12 0.56 0.50 NaN 0.09 0.17 0.52 0.30 0.50 0.03 0.34
7 Hairston 300 1.20 0.28 0.78 0.42 0.39 0.08 0.11 0.58 0.29 0.54 0.09 0.11
8 Johnson 157 1.18 0.25 0.59 0.54 NaN 0.09 0.24 0.55 0.14 0.54 0.04 0.10
9 McDonald 174 1.01 0.23 0.75 0.38 0.39 0.04 0.08 0.52 0.18 0.49 0.11 0.11
10 Tokoto 89 1.00 0.18 0.38 0.53 0.09 0.09 0.12 0.52 0.35 0.53 0.13 0.30
11 Davis 10 0.80 0.07 1.00 1.00 1.00 0.00 0.04 1.39 1.00 1.50 0.41 0.70
12 Simmons 21 2.67 0.06 0.80 0.67 NaN 0.13 0.12 0.69 0.28 0.67 0.05 0.29
13 Total 2112 1.07 1.00 0.65 0.45 0.37 0.36 0.69 0.53 0.28 0.50 0.61 0.17
14 oppTotal 2112 0.94 1.00 0.69 0.42 0.35 0.30 0.65 0.51 0.25 0.47 0.50 0.22
$`Last Game`
           POSS ORTG  USG perFTM perFGM perFGM.3 perORB perDRB perTS  FTR perEFG ARATE TORATE
Bullock      12 1.67 0.21   0.00   0.73     0.57   0.04   0.26  0.87 0.09   0.91  0.18   0.17
McAdoo       16 1.31 0.33   1.00   0.67      NaN   0.10   0.07  0.68 0.07   0.67  0.00   0.19
Hubert        1 2.00 0.21    NaN   1.00      NaN   0.50   0.33  1.00 0.00   1.00  0.00   1.00
Strickland    6 0.83 0.13   0.50   0.40      NaN   0.00   0.04  0.43 0.40   0.40  0.18   0.00
Paige         9 0.67 0.16   0.50   0.40     1.00   0.00   0.09  0.51 0.40   0.50  0.34   0.33
James         1 2.00 0.15    NaN   1.00      NaN   0.00   0.00  1.00 0.00   1.00  0.00   0.00
Hairston      9 1.78 0.19    NaN   0.55     0.67   0.10   0.07  0.73 0.00   0.73  0.04   0.00
Johnson       2 1.00 0.15    NaN   0.50      NaN   0.00   0.12  0.50 0.00   0.50  0.00   0.00
McDonald      7 0.43 0.22   0.75   0.00     0.00   0.00   0.15  0.32 1.33   0.00  0.00   0.29
Tokoto       NA   NA   NA     NA     NA       NA     NA     NA    NA   NA     NA    NA     NA
Davis         0  NaN 0.00    NaN    NaN      NaN   0.00   0.00   NaN  NaN    NaN  0.00    NaN
Simmons       0  NaN 0.00    NaN   0.00      NaN   0.25   0.17  0.00 0.00   0.00  0.22    NaN
Total        65 1.22 1.00   0.60   0.55     0.60   0.26   0.62  0.65 0.18   0.63  0.65   0.17
oppTotals    65 0.89 1.00   1.00   0.37     0.22   0.31   0.70  0.44 0.13   0.40  0.43   0.23

$`Season Totals`
         NAME POSS ORTG  USG perFTM perFGM perFGM.3 perORB perDRB perTS  FTR perEFG ARATE TORATE
1     Bullock  289 1.38 0.19   0.75   0.49     0.44   0.07   0.14  0.63 0.20   0.61  0.13   0.11
2      McAdoo  454 0.94 0.29   0.56   0.45     0.00   0.09   0.19  0.48 0.38   0.45  0.06   0.18
3      Hubert   29 1.21 0.05   0.21   0.53      NaN   0.07   0.11  0.48 0.47   0.53  0.01   0.45
4  Strickland  255 0.90 0.18   0.64   0.44     0.19   0.02   0.08  0.50 0.43   0.45  0.20   0.14
5       Paige  295 0.73 0.20   0.85   0.33     0.32   0.01   0.10  0.45 0.21   0.41  0.22   0.21
6       James   59 1.07 0.12   0.56   0.50      NaN   0.09   0.17  0.52 0.30   0.50  0.03   0.34
7    Hairston  300 1.20 0.28   0.78   0.42     0.39   0.08   0.11  0.58 0.29   0.54  0.09   0.11
8     Johnson  157 1.18 0.25   0.59   0.54      NaN   0.09   0.24  0.55 0.14   0.54  0.04   0.10
9    McDonald  174 1.01 0.23   0.75   0.38     0.39   0.04   0.08  0.52 0.18   0.49  0.11   0.11
10     Tokoto   89 1.00 0.18   0.38   0.53     0.09   0.09   0.12  0.52 0.35   0.53  0.13   0.30
11      Davis   10 0.80 0.07   1.00   1.00     1.00   0.00   0.04  1.39 1.00   1.50  0.41   0.70
12    Simmons   21 2.67 0.06   0.80   0.67      NaN   0.13   0.12  0.69 0.28   0.67  0.05   0.29
13      Total 2112 1.07 1.00   0.65   0.45     0.37   0.36   0.69  0.53 0.28   0.50  0.61   0.17
14   oppTotal 2112 0.94 1.00   0.69   0.42     0.35   0.30   0.65  0.51 0.25   0.47  0.50   0.22


Tuesday, February 26
Heels Attack NC State's Slow Defense
Here's a breakdown of a play the Heels ran to start their run against NC State on Saturday. This series shows how the Heels attacked the Wolfpack and used a simple curl play that could have ended up as an easy layup, but ended up as an even better three pointer for Reggie Bullock.

Marcus Paige, the blur in white running towards the
baseline, goes to set a pick for Bullock.
Lorenzo Brown(?), previously guarding Paige, calls down to Reggie
Bullock’s (35 in white) man (Warren or Purvis?) to tell him a pick is
coming.

Reggie Bullock, starts running towards the top of the 3
point line, away from his man. Paige is
ready to set a pick, but is more than an arm’s length away from Bullock’s
defender. Lorenzo Brown remains at the
right hand side of the free throw line, watching the ball but orienting his
body towards Paige and Bullock. At this
point, there are 4 black jerseys around
the FT line guarding 3 white jerseys.
Bullock’s man is still in contact with Bullock. If Paige were to sprint towards the opposite
block and demand the ball (see green arrow below), no one would be guarding
him. It’s the kind of quick realization
that it’s not fair to expect of a freshman, especially a point guard. It’s likely that Paige is just focusing on
running the play for Bullock, which is appropriate. Breaking plays for easy layups is something
that guys in the NBA don’t always do, so it’s not fair to expect the same of an
18 year old freshman. Still, it speaks to
State’s luck that the Heels didn’t recognize this opportunity for an easy layup,
regardless of the outcome of this play.


Lorenzo Brown sees Bullock running towards the top of the 3
point line, but remains with a foot in the paint. James Michael McAdoo waits at the top of the
key to screen whoever comes out to guard Bullock. Marcus Paige is hugged by Bullock’s former
defender.

Brown tries to step out to challenge Bullock on the
curl. He meets McAdoo squarely in the
chest. McAdoo’s defender, Richard
Howell, standing at the foot of the “A” in the paint, is not hedging. Since Howell is the best rebounder on either
team, he was likely told to stay around the paint. This leaves Lorenzo Brown the task of getting
around McAdoo quickly to challenge the pass and shot.

As Bullock squares up and begins his shooting motion, Brown
is still 6 feet away, with McAdoo still in contact. McAdoo’s man, Richard Howell, stays at the
top of the paint to be in prime rebounding position.

The result is an open three for a 44% shooter. The shot goes in, and this is the start of the 13-4 the Heels
put together from 8:22 to the NC State timeout at 4:58. That run broke the game open for the Heels and was pivotal for the Carolina victory.
Subscribe to:
Posts (Atom)